workshop
Analyzing Geospatially Produced Maps for Understanding DTP Vaccination Coverage and Accessibility on Newborn Fatality Rates with a Concentration in Sub-Saharan Africa
Gabi Burgin
College of William and Mary
April 19, 2020
Introduction
The DTP (Diphtheria, Tetanus, and Percussion) vaccine is essential to sustaining newborn life, and a majority of the countries that makeup Sub-Saharan Africa have astonishingly low coverage rates. The low coverage rates stem from a lack of resources and capital to provide immunization, and by not having access to something as fundamental as a vaccine, the infantile mortality rates in these countries are extremely prominent [1,2]. With an 86% global usage rate and a 90% success rate, it is crucial that newborns get access to this vaccine. Without this crucial vaccine, there is a 70-100% risk of newborn fatality [1]. Being able to access this vaccine is critical, and by mapping the countries in Sub-Saharan Africa that don’t have the resources to provide the vaccine, more aid and capital can be given to those areas. With the goal of global healthcare in mind, mapping these regions will help establish precedents towards helping countries that need it.
Diphtheria, Tetanus, and Percussion are diseases that substantially pertain to newborns. The three diseases can be spread through person-to-person contact, or cuts and wounds. Potential symptoms are difficulty breathing, whooping cough, stiffening of the muscles, pneumonia, and more. There are five doses of the DTP vaccine and they are given at the ages of two months, four months, six months, fifteen to eighteen months, and lastly, four to six years [8]. In 2018, the African region had a DTP1 vaccination coverage of 84%. Thirteen standing countries exist that have yet to fully eliminate tetanus: a disease that is prevented from the DTP (diphtheria, tetanus, and pertussis) vaccine. Nine of these thirteen countries have less than 50 percent coverage, with six of the nine countries located in Africa [1]. With such low coverage rates compared to the globe, it is imperative that they be raised to decrease unnecessary child deaths.
While conducting research on this topic, I came across studies that exhibited the same research methods, however, they were used in different ways. For this research paper, I will be taking two of the studies done and comparing their differences. The first geospatial data science study method involved taking survey and census data from Sub-Saharan African countries and producing GEOTIFF raster files, CSV files, and Code files. This data was then converted into black and white mapped satellite images of Sub-Saharan Africa to show DTP coverage progression from 2000-2016 [2]. On the other hand, the second geospatial data science method involved five specific African countries (Nigeria, Cambodia, Mozambique, DRC, and Ethiopia) rather than the entire continent. Specific covariates were chosen to be studied, then through the use of census, demographic, and Health Surveys Data, 1 × 1 km spatial resolution were predicted [3].
The central research question for this study is, “Will there ever be a possibility of 100 percent DTP vaccination coverage worldwide?” Additionally, another focus will be “With all of the data gathered, what are the next steps to providing aid to Sub-Saharan countries to increase DTP immunization and decrease neonatal deaths?” These two questions go hand in hand and stem from one another. The models created do an excellent job at identifying where the problem at hand is located, however that is where the research ends. With the Sub-Saharan locations of low DTP vaccination coverage pinpointed, now further data needs to be produced on how to move forward, where to allocate resources and capital, and furthermore how to globally reach 100 percent DTP coverage.
Inquiry Type
The geospatial data science method at hand stems from an exploratory inquiry. This means that the study will be working to search for an explanation as to why certain aspects are happening through a research process, which in turn will generate additional questions to further study [11]. The central research question seeks to identify whether global vaccination coverage can be established and where resources, capital, and aid can be provided due to mapped vaccination coverage estimates. Through the geospatially generated maps, we are able to explore regions of concern and further able to study how to adapt these regions. Additional questions in this exploratory inquiry are, “which resources are most needed in order to aid regions of low DTP coverage?” and “how can aid be equally distributed to decreased maternal and neonatal deaths due to lacking DTP vaccinations?
Data Methods
Method 1: Bayesian Geostatistical Model
The Institute for Health Metrics and Evaluation (IHME) seeked to geospatially map DTP vaccination (and DTP booster) coverage in Sub-Saharan Africa from the years 2000-2016. Upon conducting 183 population-based surveys on 881,268 children in 49 African countries, dose specific DTP coverage pixel-level map estimates were created. These mapped estimates were 5x5 km produced black and white satellite images of the African continent with the black colors representing low-to-none DTP vaccination coverage while the white colors represented high-to-full DTP vaccination coverage. The surveys taken allowed for the data collected to be produced into geospatial data sets. The surveys used responses based on the presence or absence of vaccine cards or maternal recall. The mentioned vaccine cards provide information on the type and number of vaccines a person was given and at what time. If a child didn’t have a vaccine card, the mother would recall whether or not her child received the vaccine after being born. The surveys provided data to be turned into GeoTIFF raster files, CSV files, and Code files to create the geospatial maps[2].
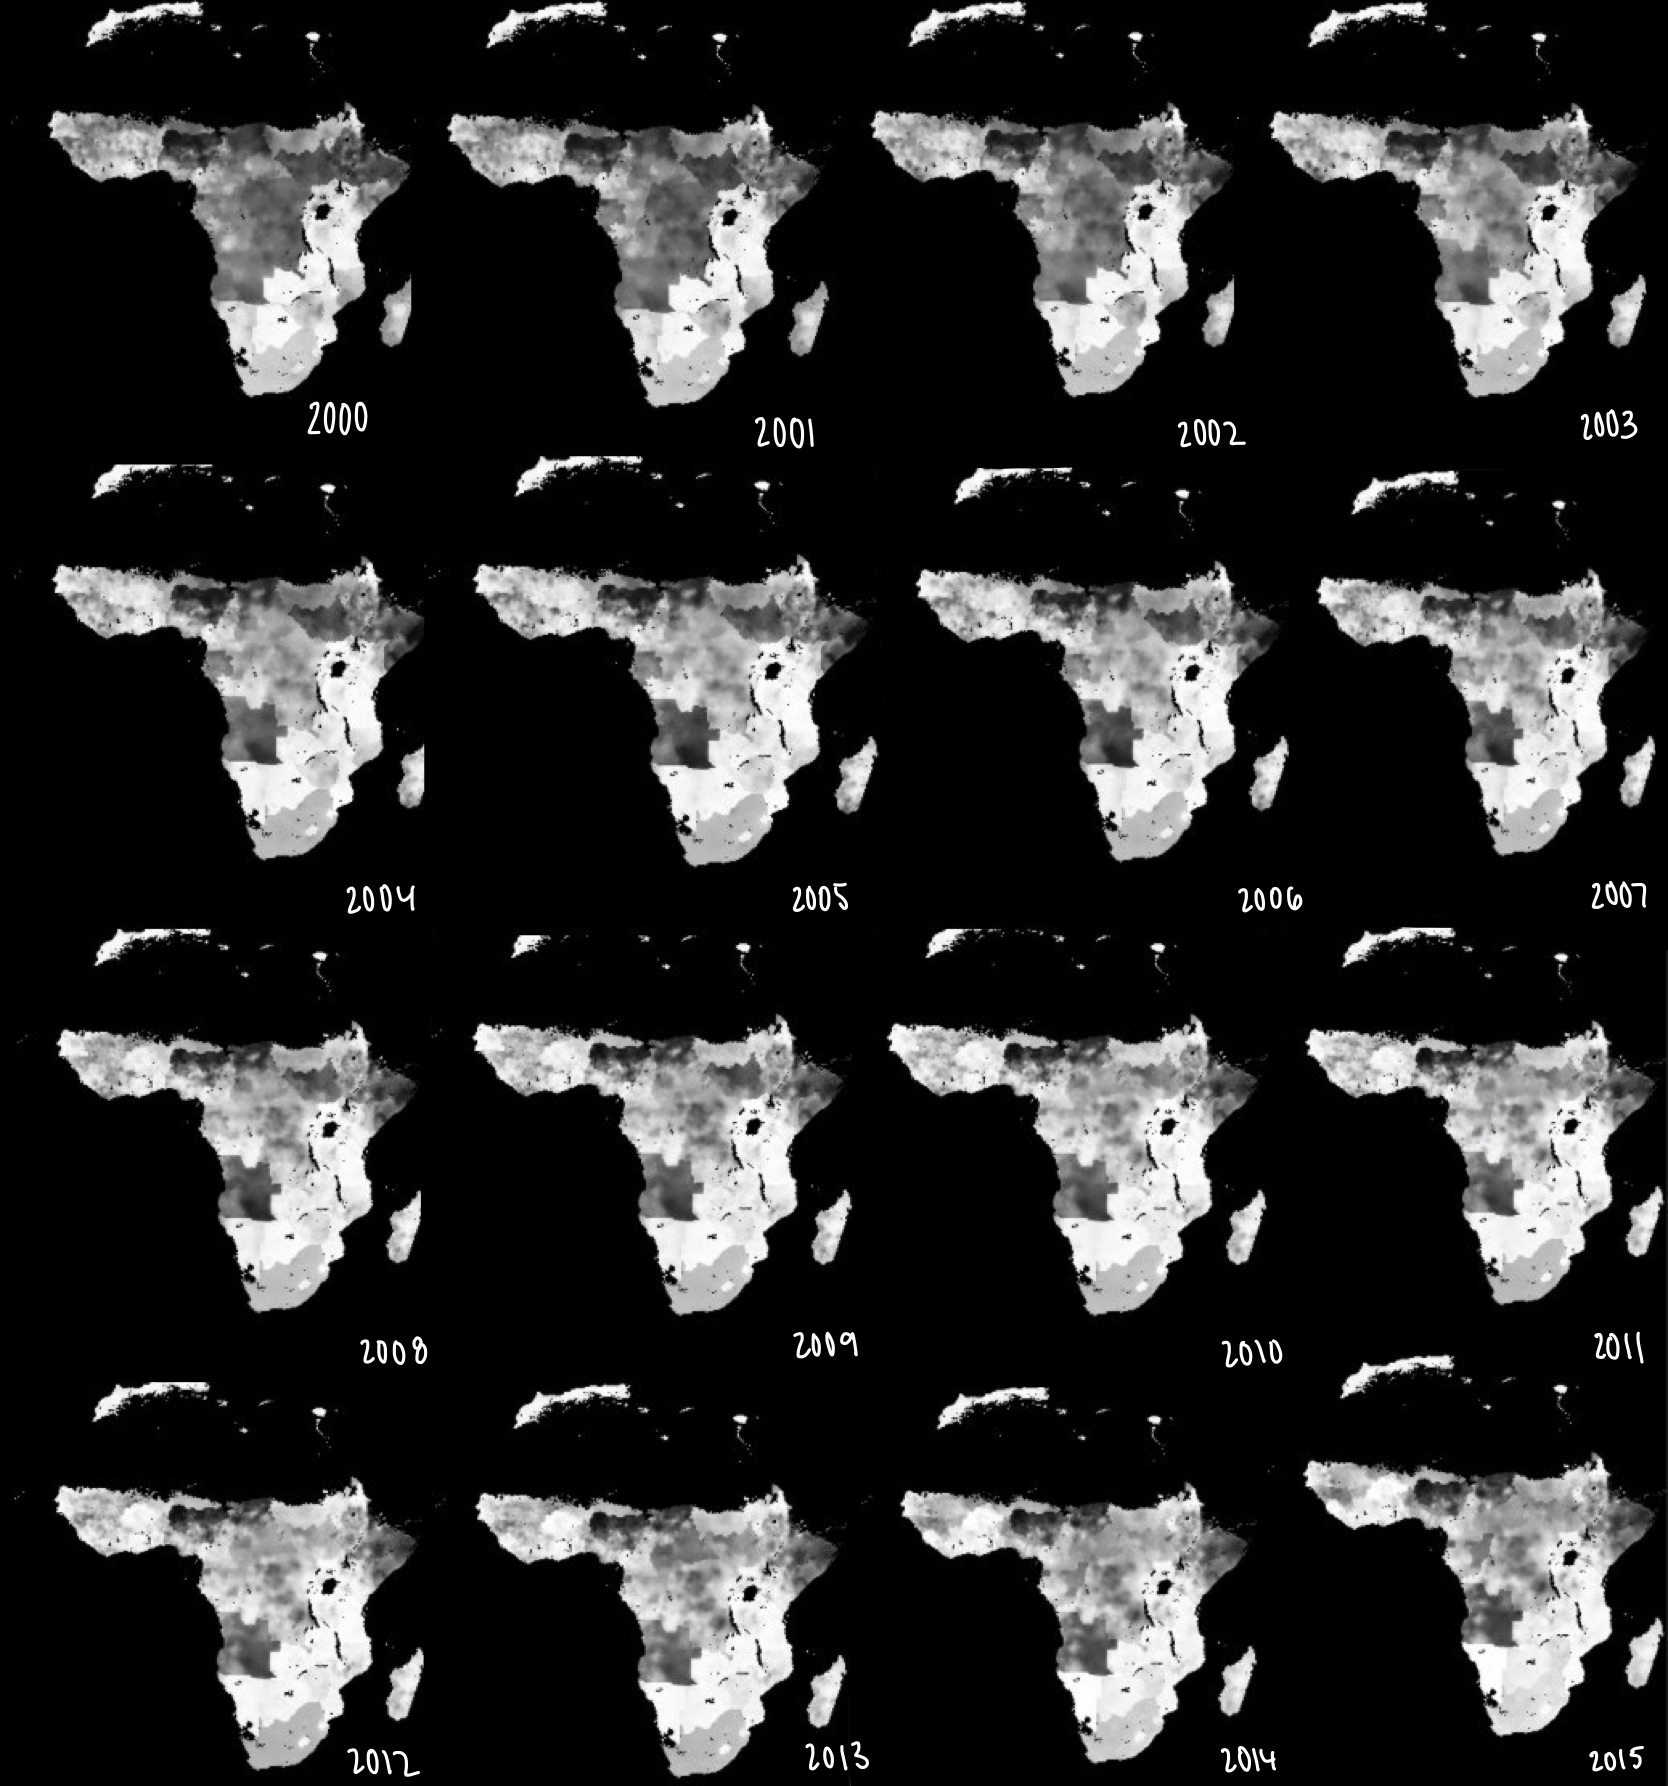 [Figure 1: Mapped DTP Vaccination from 2000-2015]
Here are the mapped images from the years 2000-2015. As you can see, there is a significant increase in white, especially in Sub-Saharan Africa, throughout the years. From the bayesian model, the DTP 3 booster coverage showed an increase in “72.3% (95% uncertainty interval [UI] 64.6–80.3)” [12]. A main conclusion made from this study was that there are many geographical inequalities throughout Africa. Due to these inequalities, “DPT3 coverage at the second administrative (i.e., district) level varied by more than 25% in 29 of 52 countries, with only two (Morocco and Rwanda) of 52 countries meeting the Global Vaccine Action Plan target of 80% DPT3 coverage or higher in all second-level administrative units” [12]. This data exemplifies the fact that even though the overall DTP 3 booster coverage increased throughout Africa, there are still many factors inhibiting appropriate vaccination etiquette.
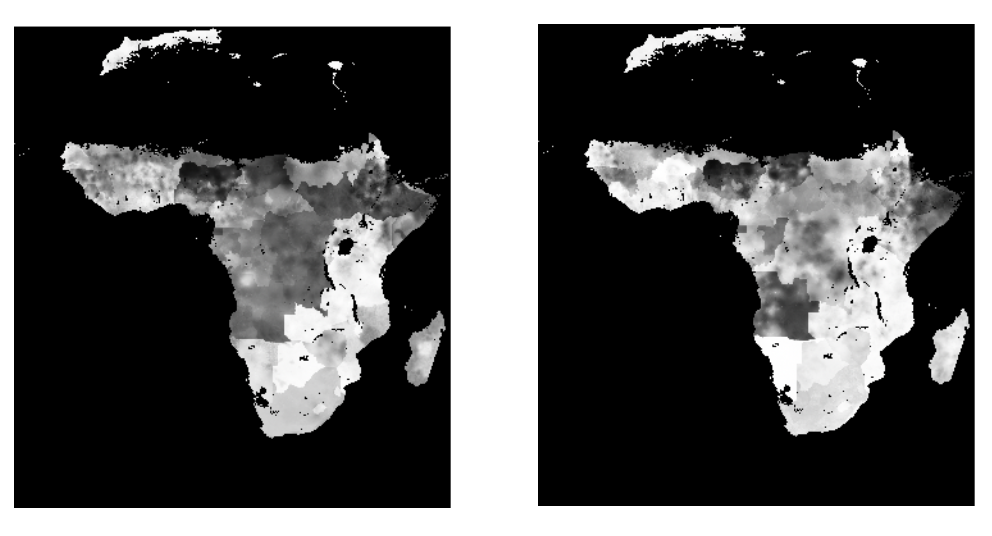 [Figure 2: Mapped DTP Coverage Estimates in 2000 and 2016]
In the image above, we get a close-up view in the differences between the DTP coverage in the years 2000 and 2016. We immediately see no difference in Northern Africa, however, in Sub-Saharan Africa there is quite a bit more white color visible. The white color mainly developed in the middle and low regions of Sub-Saharan Africa, but there are changes throughout. The areas of lowest DTP coverage, “(≤ 50%) were identified in the Sahel, Somalia, eastern Ethiopia, and Angola” [12]. These countries are located in the horn of Africa (Ethiopia and Somalia), the Saharan Desert region (Sahel), and the lower left region (Angola). The geostatistical mapped estimates reflect this finding, as those regions have a lot of dark color.
Method 2: Geostatistical Predicted Mapping
In order to indicate the performance of a country’s national healthy and immunization system, “the coverage of childhood vaccines—the proportion of the target population that is vaccinated,” is used [3]. The World Health Organization (WHO) created a Routine Immunization (RI) program which is designed to increase vaccination coverage around the world. In places where gaps exist between RI, Supplementary Immunization Activities (SAI’s) are used to help additionally boost vaccination coverage rates. SAI’s are more specifically used in, “interrupting disease circulation and generation of herd immunity and thus play a key role in disease control and elimination efforts” [3]. By mapping areas of vaccination concern, RI and SAI data are gathered to view how effective they truly are in preventing disease. In the case of this study, the Sub-Saharan African Region is being examined to value how prominent DTP vaccination coverage rates are, and how effective RI and SAIs are.
This method focused on mapping 1x1km DTP coverage through the use of RI’s and SIA’s in five low-to-middle income countries (LMIC’S: Nigeria, Cambodia, Mozambique, DRC, and Ethiopia). In order to gather data, Demographic and Health Surveys were conducted. After the was collected, covariates for the LMIC’s were selected, then turned into predicted mapped estimates of under-vaccinated areas. In order to calculate the data, a multivariate model rather than a univariate model was used to join all three doses of the DTP vaccination together.
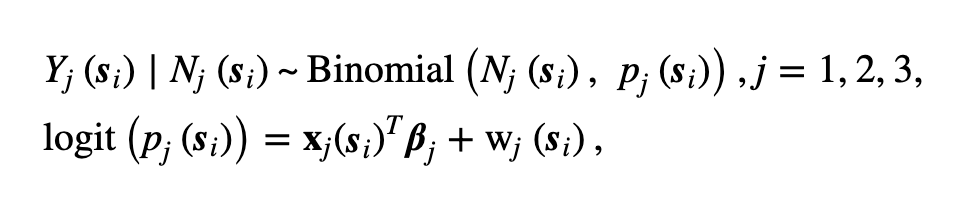 [Figure 3: Multivariate model]
The following multivariate model operates with, “j indexes the doses and xj(.) and βj∈Rk are the respective covariate vector and regression parameters for the jth dose. For a generic location s, the process w(s)=(w1(s), w2(s), w3(s))T is a zero-mean multivariate Gaussian process with cross-covariance function Cw used to account for spatial variation in the model. The elements of Cw are such that for any pair of locations s and s′, Cw(s,s′)=cov(wj(s),wj′(s′)),(j,j′=1,2,3)” [3].
The selected covariates of the study are as follows: Nigeria (aridity and travel time), Ethiopia (distance to urban areas, travel time, and livestock), DRC (distance to urban areas, environmental variables and livestock density), Cambodia (distance to populated places and environmental variables), and Mozambique (distance to highways). Each country was given a selected covariate due to their unique geographical region and their resources at hand. A major finding from the covariates was, “remoteness as measured by travel time to the nearest major settlement and the distance variables consistently had a significant negative association with coverage of both vaccines, matching findings elsewhere” [3]. In terms of DTP coverage, “the effective ranges for Nigeria were 385, 761 and 588 km for doses 1, 2 and 3, respectively. For all other countries, the effective range for DTP1 (274–1894 km) was consistently greater than those of DTP2 (61–896 km) and DTP3 (68–1565 km). The cross-covariance parameters show that significant spatial interdependence exists among the three DTP doses (conditional on the covariates included in the models). Correlations of at least 0.91 were estimated between the doses through the underlying spatial processes” [3]. As determined, location plays a significant role in vaccination coverage.
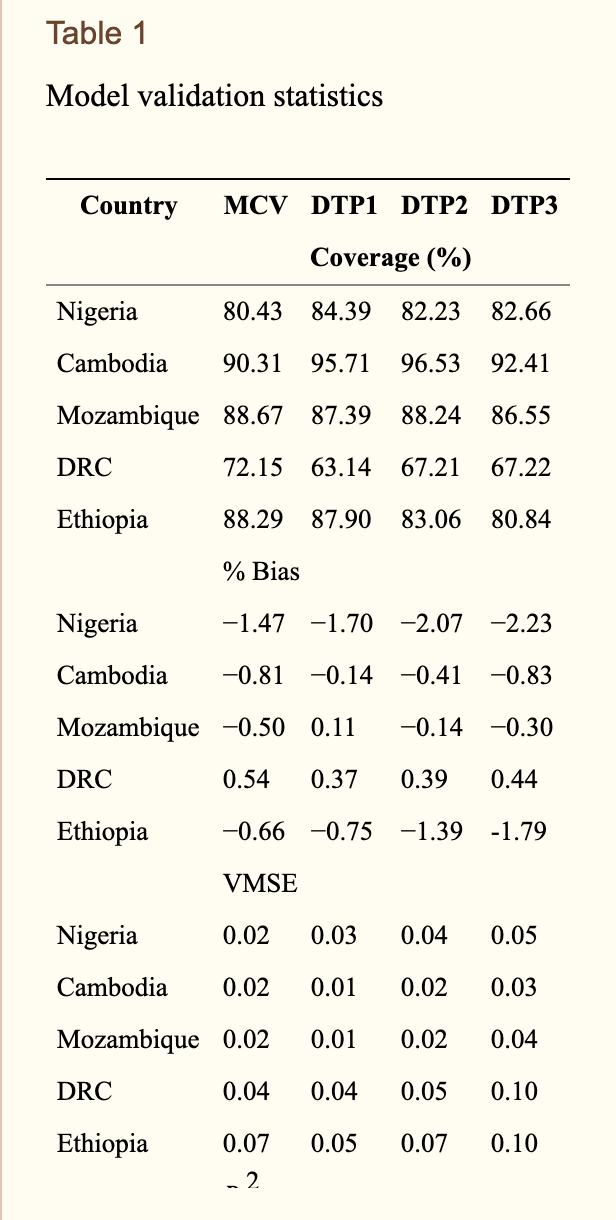 [Figure 4: Model Validation Statistics]
The figure above shows the percentages of the DTP and booster vaccination coverage across the five LMIC’s. Across the Sub-Saharan African countries that were studied, Mozambique had the highest vaccination coverage rates while the DRC had the lowest coverage rates. Additionally, the table above shows the statistical significance of the resulting findings.
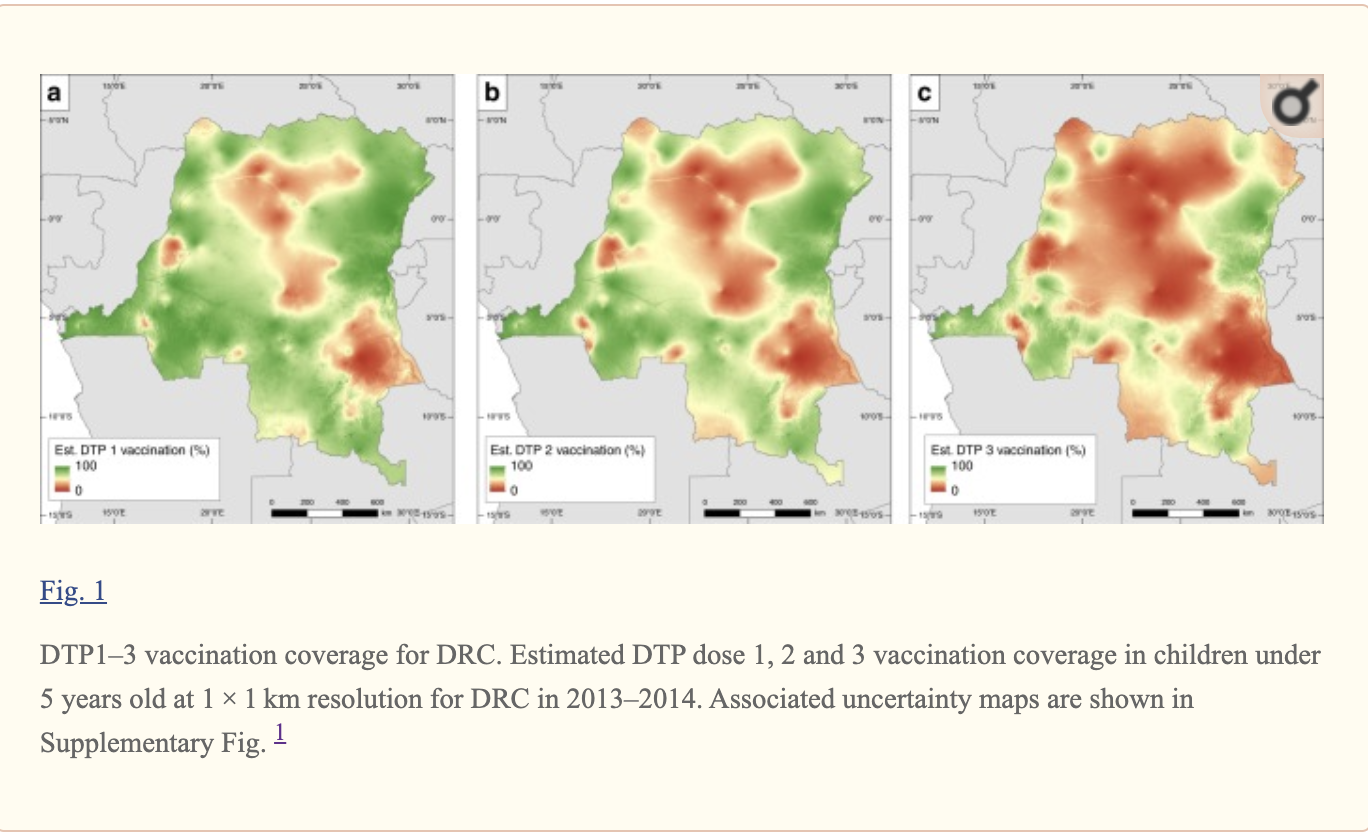 [Figure 5: DTP 1-3 Vaccination Coverage in the DRC]
As you can see in this image, a mapped estimation of the DTP vaccination coverage in the Democratic Republic of the Congo was created. The red colors correlate to zero percent DTP coverage whereas the green colors correlate to one-hundred percent DTP coverage. A scale from red to green has been provided. The three maps relate to the difference in DTP vaccination coverage from booster to booster (DTP 1, DTP 2, and DTP 3) from the years 2013-2014.
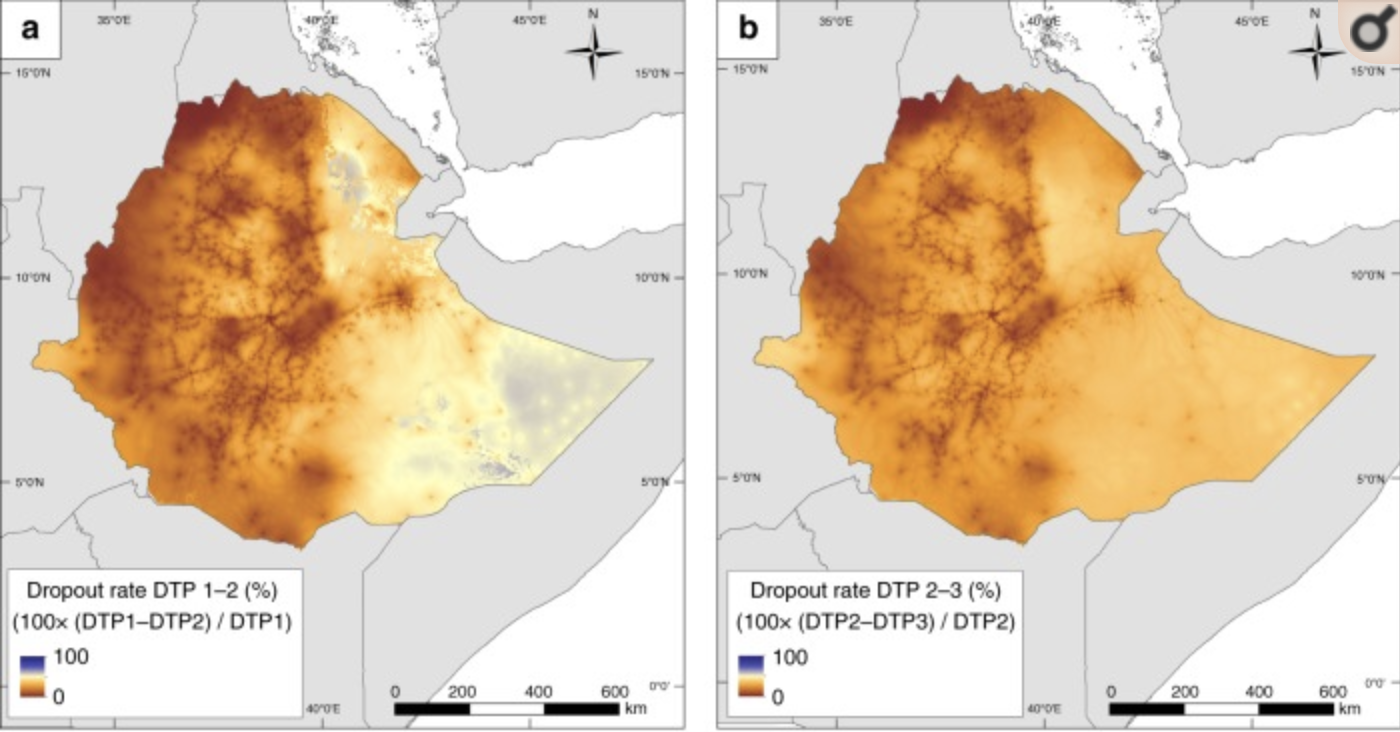 [Figure 6: Ethiopian Drop Out DTP Vaccination Rates]
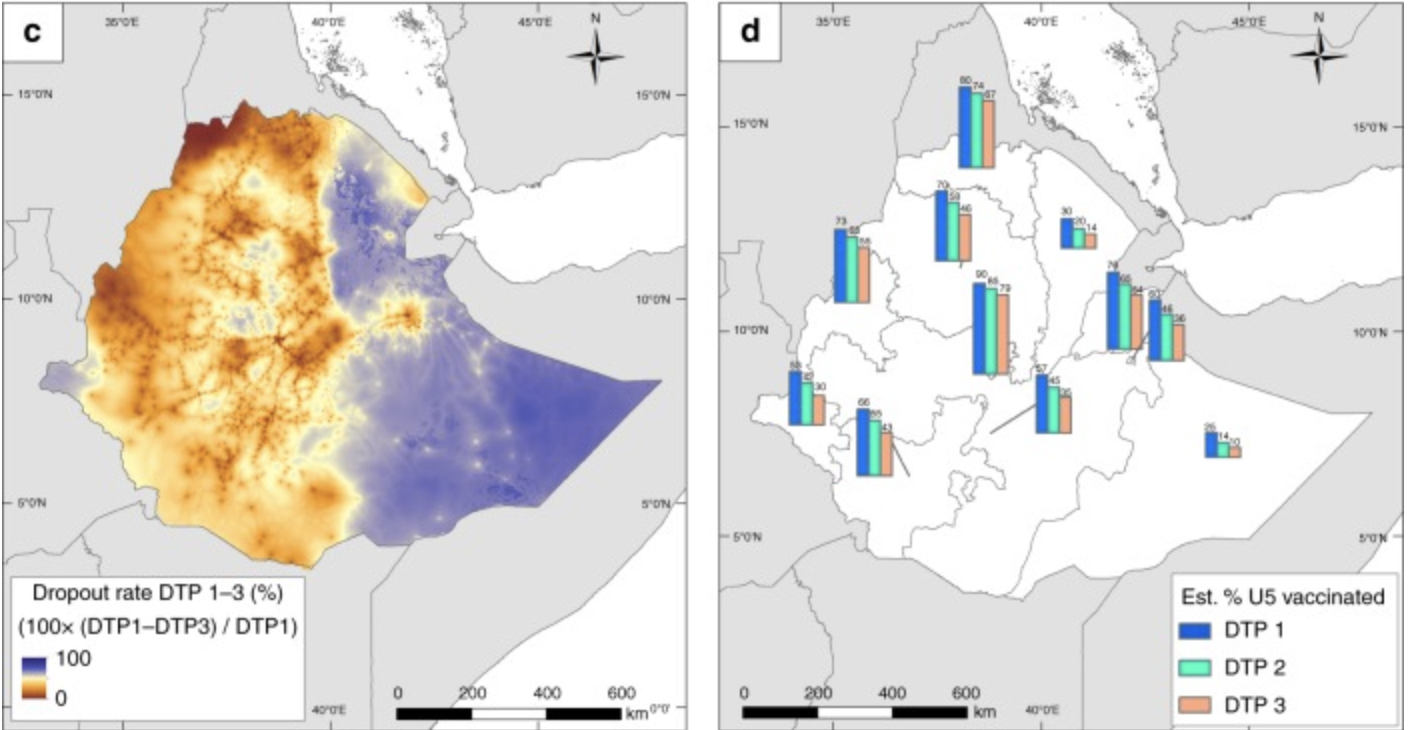 [Figure 7: Ethopian Drop Out DTP Vaccination Rates and Percentage Vaccinated]
The figures above map out Ethiopia’s DTP vaccination drop out rate. Since Ethiopia had the highest coverage rates, it is important to look at how many people actually don’t fully receive all boosters of the vaccination. In the maps above, the blue color represents 100 percent drop out while the dark orange colors represent no dropouts. It is shown that the eastern side of Ethiopia has the highest dropout rates overall from boosters 1-3. However, when looking at the individual boosters alone, the drop out rates are quite low for the entire country.
Main results of this study conclude that there were, “substantial gaps in the coverage of DTP1 particularly in Nigeria, DRC and Ethiopia—suggesting poor access to or utilization of RI services (including vaccine stockouts in existing health facilities), vaccine refusal or lack of awareness about vaccines, low parental education and non-vaccination due to mothers’ social engagements, coupled with a clear evidence of lack of health system continuity in these countries” [3]. With there being such low coverage rates for this crucial vaccine in Sub-Saharan Africa, it is critical that resources and capital be provided to the lacking areas.
Further Study
The gathered geostatistical data showed great regions of DTP undervaccination in Sub-Saharan Africa. By using the mapped estimates, locations and factors causing the undervaccination were determined, however that is where the study ended. With the sustainable development goal of global healthcare in mind, further studies need to be done to help increase the vaccination coverage rates. With the undervaccinated locations now at hand, resources and capital can be given to those areas in order to increase the rates.
References
[1] Vaccination and Immunization Statistics. (2019, July). Retrieved from https://data.unicef.org/topic/child-health/immunization/
[2] Africa Diphtheria-Pertussis-Tetanus Vaccine Coverage Geospatial Estimates 2000-2016. (2019). Institute for Health Metrics and Evaluation (IHME). Retrieved from https://ghdx.healthdata.org/record/ihme-data/africa-diphtheria-pertussis-tetanus-vaccine-coverage-geospatial-estimates-2000-2016
[3] Edson Utazi, C., Thorley, J., Alegana, V. A., Ferrari, M. J., Takahashi, S., Metcalf, C. J., … Tatem, A. J. (2020, February 23). Mapping vaccination coverage to explore the effects of delivery mechanisms and inform vaccination strategies. Retrieved from https://www.ncbi.nlm.nih.gov/pmc/articles/PMC6456602/
[4] Pezzulo, C., Bird, T., Utazi, E. C., Sorichetta, A., Tatem, A. J., Yourkavitch, J., & Burgert-Brucker, C. R. (2016, August). Geospatial Modeling of Child Mortality across 27 Countries in Sub-Saharan Africa. Retrieved from https://www.dhsprogram.com/pubs/pdf/SAR13/SAR13.pdf
[5] Poy, A., Van den Ent, M. M. V. X., Sosler, S., Hinman , A. R., Brown, S., Sodha , S., … Mihigo, R. (n.d.). Monitoring Results in Routine Immunization: Development of Routine Immunization Dashboard in Selected African Countries in the Context of the Polio Eradication Endgame Strategic Plan . Retrieved February 23, 2020, from https://academic.oup.com/jid/article/216/suppl_1/S226/3935057
[6] Peck, M., Gacic-Dobo, M., Diallo, M. S., Nedelec, Y., Sodha, S. S., & Wallace, A. S. (2019, October 24). Global Routine Vaccination Coverage, 2018. Retrieved from https://www.cdc.gov/mmwr/volumes/68/wr/mm6842a1.htm
[7] Panciera, R., & Muñiz, M. (2018, October). Guidance on the Use of Geospatial Data and Technologies in Immunization Programs. Retrieved from https://www.unicef.org/media/58181/file
[8] Vaccine Information Statement. (2020, April 1). Retrieved from https://www.cdc.gov/vaccines/hcp/vis/vis-statements/dtap.html
[9] Schlesinger, J. (2013, January 1). Agriculture along the urban-rural continuum : a GIS-based analysis of spatio-temporal dynamics in two medium-sized African cities. Retrieved from https://www.researchgate.net/publication/283648245_Agriculture_along_the_urban-rural_continuum_a_GIS-based_analysis_of_spatio-temporal_dynamics_in_two_medium-sized_African_cities
[10] Sub-Saharan Africa . (2019). Retrieved from https://data.worldbank.org/region/sub-saharan-africa
| [11] Developing a central research question | MESHGuides. (n.d.). Retrieved April 18, 2020, from http://www.meshguides.org/guides/node/468 |
[12] Mosser, J. F., & Gagne-Maynard, W., Rao, P.C., Osgood-Zimmerman, A, (et.al). (2019, April 8). Mapping diphtheria-pertussis-tetanus vaccine coverage in Africa, 2000–2016: a spatial and temporal modeling study. Retrieved from http://www.healthdata.org/research-article/mapping-diphtheria-pertussis-tetanus-vaccine-coverage-africa-2000–2016-spatial-and