workshop
Assignment 2
Gabi Burgin
April 5, 2020
Analyzing Geospatially Produced Maps for Understanding DTP Vaccination Coverage and Accessibility on Newborn Fatality Rates with a Concentration in Sub-Saharan Africa
Introduction
The purpose of this research is to analyze areas of low DTP vaccination coverage in Sub-Saharan Africa and their effects on newborn fatality rates. Through the use of gathering census and survey data, geotiff raster, and code files, black and white mapped images of Africa were then able to be created to show the extent of the DTP vaccination coverage. The household surveys used responses based on the presence or absence of vaccine cards or maternal recall to suggest whether or not a newborn was able to receive the vaccination. The satellite mapped images show detailed vaccination coverage over sixteen years from 2000-2016 and the growth that has occurred over the years. Through analyzing, understanding, and evaluating the geospatial models, a deeper knowledge of the extent to which these life-dependent vaccinations are accessible will be established. Additionally, through thorough analysis, limitations and any possible gaps in the research methods will be assessed.This study references demographic and household health survey data, geotiff raster files, and mapped satellite images to outline DTP vaccination coverage in Sub-Saharan Africa. [2, 3]
Human Development Topic
The DTP (Diphtheria, Tetanus, and Percussion) vaccine is essential to sustaining newborn life, and a majority of the countries that makeup Sub-Saharan Africa have astonishingly low coverage rates. The low coverage rates stem from a lack of resources and capital to provide immunization, and by not having access to something as fundamental as a vaccine, the infantile mortality rates in these countries are extremely prominent [1,2]. For my research, I looked to examine the areas in Sub-Saharan Africa with the lowest DTP vaccination coverage and the effects it has on newborn fatality rates. I chose to research this vaccination as it is one of the most common and widespread vaccinations given at birth. With an 86% global usage rate and a 90% success rate, it is crucial that newborns get access to this vaccine. Without this crucial vaccine, there is a 70-100% risk of newborn fatality [1]. Additionally, I am in the pre-medical field of study and find this topic quite interesting. The ability to provide life-saving vaccinations affects not only a single person or country, but the entire globe. Being able to access this vaccine is crucial, and by mapping the countries in Sub-Saharan Africa that don’t have the resources to provide the vaccine, more aid and capital can be given to those areas. With the goal of global healthcare in mind, mapping these regions will help establish precedents towards helping countries that need it.
Diphtheria, Tetanus, and Percussion are diseases that substantially pertain to newborns. The three diseases can be spread through person-to-person contact, or cuts and wounds. Potential symptoms are difficulty breathing, whooping cough, stiffening of the muscles, pneumonia, and more. There are five doses of the DTP vaccine and they are given at the ages of two months, four months, six months, fifteen to eighteen months, and lastly, four to six years [8]. In 2018, the African region had a DTP1 vaccination coverage of 84%. Thirteen standing countries exist that have yet to fully eliminate tetanus: a disease that is prevented from the DTP (diphtheria, tetanus, and pertussis) vaccine. Nine of these thirteen countries have less than 50 percent coverage, with six of the nine countries located in Africa [1]. With such low coverage rates compared to the globe, it is imperative that they be raised to decrease unnecessary child deaths.
Sub-Saharan Africa
This study focused on DTP vaccination coverage rates in Sub-Saharan Africa. This region of Africa is located south of the Saharan Desert and is in the process of “urban transformation.” In many of the small to middle sized Sub-Saharan countries, “urban and periurban agriculture has evolved as an important livelihood strategy for millions” [9]. There are currently forty-eight countries that make up Sub-Saharan Africa, totalling to 88.9% of the entire continent. As of 2018, Sub-Saharan Africa has a population of 1.078 billion and a 1.71 Trillion GDP (US $) [10]. The Sub-Saharan economy has been on the rise since 2000, but we still see lacking vaccination coverage, especially in the DTP vaccination and its boosters. Since March 2019, only thirteen countries remain that still have maternal and neonatal tetanus, with seven of those countries located in Sub-Saharan Africa having less than fifty percent DTP coverage. Additionally, “Globally in 2018, two in five children unvaccinated for DTP3 lived in just four countries,” Nigeria being one of those four [1]. The current life-expectancy for someone living in Sub-Saharan Africa is only 60.88 years, and by increasing vaccination coverage rates, that number will hopefully rise [10]. With a 70-100 percent fatality rate, it is crucial that neonatal and maternal tetanus be eradicated, and Sub-Saharan Africa is a location of concern regarding the DTP vaccine [1].
Creating Geospatial Satellite Maps
In order to indicate the performance of a country’s national healthy and immunization system, “the coverage of childhood vaccines—the proportion of the target population that is vaccinated,” is used [3]. The World Health Organization (WHO) created a Routine Immunization (RI) program which is designed to increase vaccination coverage around the world. In places where gaps exist between RI, Supplementary Immunization Activities (SIA’s) are used to help additionally boost vaccination coverage rates. SIA’s are more specifically used in, “interrupting disease circulation and generation of herd immunity and thus play a key role in disease control and elimination efforts” [3]. By mapping areas of vaccination concern, RI and SIA data are gathered to view how effective they truly are in preventing disease. In the case of this study, the Sub-Saharan African Region is being examined to value how prominent DTP vaccination coverage rates are, and how effective RI and SIA’s are.
From the years 2000-2016, mapped estimates of the DTP vaccination coverage in Sub-Saharan Africa were created. The mapped estimates used gathered data which was then converted to black and white satellite images to see the progression in DTP coverage over sixteen years. The data consisted of population based household-surveys, subnational geographic location, GEOTIFF raster files, CSV files, and Code files [2]. The process was quite lengthy, but the final mapped products are very helpful in determining where DTP vaccination coverage rates need to increase, how the coverage rates have increased over the years, and where to put in resources and aid to help eradicate maternal and neonatal tetanus.
To begin the process of mapping vaccination coverage, the desired location needed to be selected (for the purpose of this study, it was countries in Sub-Saharan Africa). Upon selecting a location, data needed to be gathered. Demographic and Health Surveys Data were used to generate the geospatial maps. Some of the surveys were used to determine whether or not immunization records existed in households. This would lead to the presence or absence of the DTP vaccine. In the case that vaccination cards didn’t exist, maternal recall would then be referenced to determine whether or not a newborn had received the DTP vaccination [2]. Upon collecting survey data, certain covariates were selected to be studied from country to country (travel time, aridity, distance to urban areas, and livestock density for example) [3]. These covariates were then turned into 1x1km [2] and 5x5km [3] spatial resolutions.
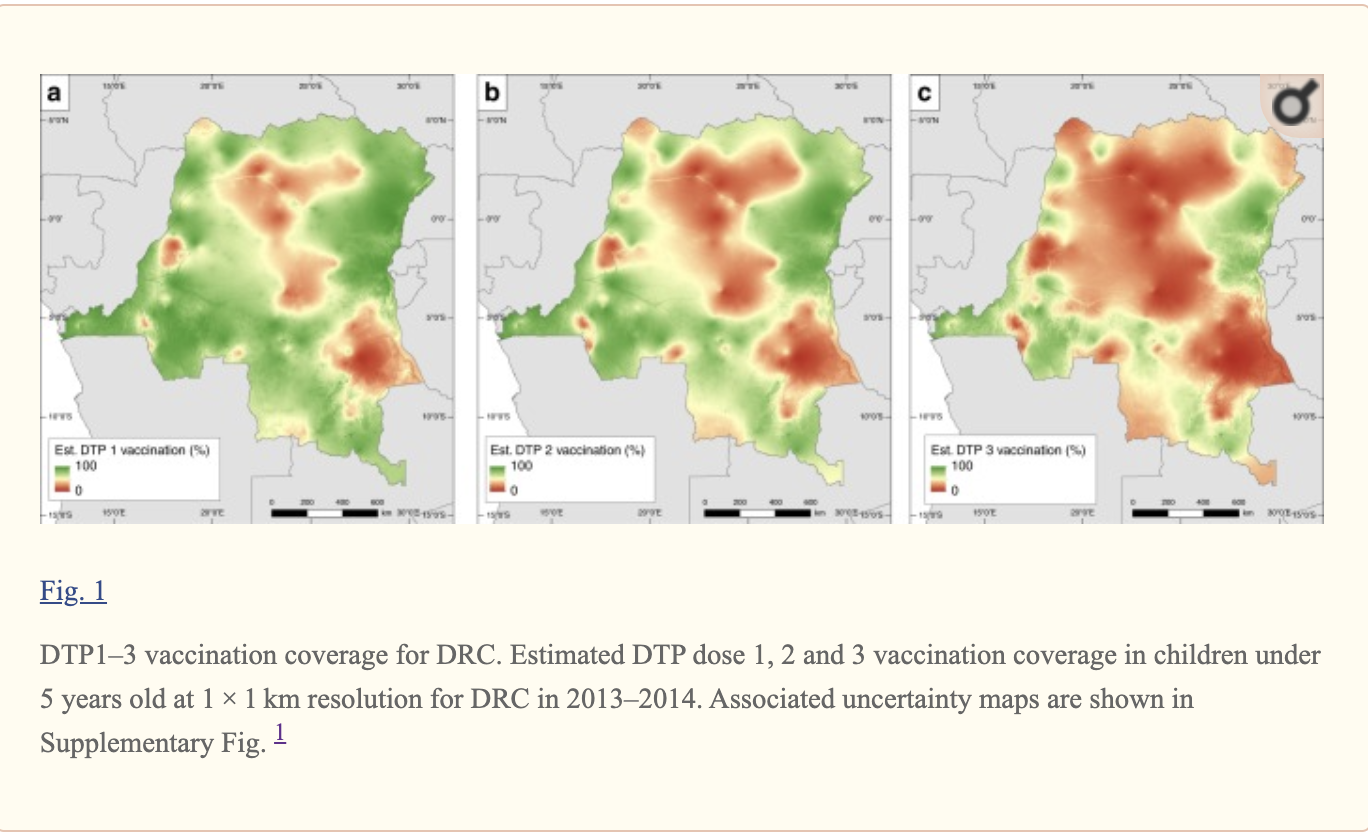
[3] As you can see in this image, a mapped estimation of the DTP vaccination coverage in the Democratic Republic of the Congo was created. The red colors correlate to zero percent DTP coverage whereas the green colors correlate to one-hundred percent DTP coverage. A scale from red to green has been provided. The three maps relate to the difference in DTP vaccination coverage in children under the age of five years old from 2013-2014 in the DRC.
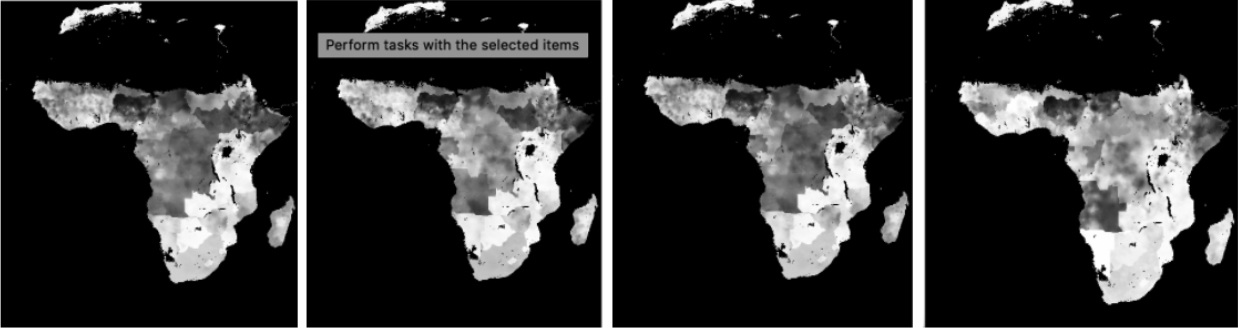
[2] These images are mapped estimates of the DTP vaccination coverage in Sub-Saharan Africa from 2000-2016. The farthest image on the left is in 2000 while the farthest image on the right is in 2016. The white colors represent vaccine coverage while the black colors represent an absence in the DTP vaccine. As you can see, throughout the sixteen years, there is substantially more white at the end of the sixteen years rather than at the beginning, showing an increase in DTP vaccination coverage in Sub-Saharan Africa.
Global Context
In line with Amartya Sen’s definition of human development, the inability to receive such a common and necessary vaccination is a prime example of an unfreedom. More specifically, security and economics. Sen’s definition of human development involves not only increasing incomes, but being able to sustain and employ freedoms, many of which are diminished due to the inability to receive this vaccination. The lacking vaccine coverage rates stem from these unfreedoms and create poverty. The research in this study ties into many of Amartya Sen’s human development topics and seeks to find ways in which geospatial data can combat the low vaccination coverage rates. Additionally, this analysis seeks to solve the Sustainable Development Goal (SDG) of Global Healthcare, Disease Control, and Good Health/Well-Being. An increase in Sub-Saharan DTP vaccine coverage will not only help the people that inhabit those countries, but help stop the spread of tetanus around the globe.
Further Limitations
Having mapped images of vaccination coverage is extremely important to show which countries have less access to crucial vaccines over others. This helps determine where stronger efforts in healthcare should be placed. However, by mapping vaccine coverage, we are solely given an approximate location in which the DTP vaccine is less prominent. In order to eradicate tetanus and other neonatal/maternal diseases, we must know which resources countries are lacking in order to send aid. In addition to the location in which there is low vaccination coverage rates, one must determine the resources needed in accordance to the specific location to increase total coverage.
Discussion
This study looked to use geospatial data to determine DTP vaccination coverage rates in Sub-Saharan Africa and their increase throughout past years on the effect of neonatal fatalities. While mapped estimates of DTP1-3 and booster coverage rates were created effectively, there are still certain matters that could have played a role in any limitations. Firstly, the geography in which citizens live plays a large role in access to medical aid and resources. Depending on what the climate, terrain, etc. is in the location these residents live, there could be more difficulty in accessing adequate medical care. Additionally, since survey data was used, there could be minor inaccuracies. People could have withheld the truth on the surveys they took which may have caused the maps to be slightly imprecise. Along with survey data, census data was also used and could have been outdated causing inaccuracies as well [3]. However, the two main articles I read both mapped DTP coverage areas in Sub-Saharan Africa and found that there has been an increase in coverage. With the goal of global healthcare and one-hundred percent DTP coverage in mind, this increase in immunization is a step in the right direction. The use of geospatial data helped to show where more resources need to be allocated in order to decrease the number of unnecessary child deaths. Moving forward, my research will be focused on these questions: Will there ever be a possibility to have one-hundred percent global vaccination coverage? With this data gathered, what are the next steps to providing aid to Sub-Saharan countries to increase DTP immunization and decrease neonatal deaths?
References
[1] Vaccination and Immunization Statistics. (2019, July). Retrieved from https://data.unicef.org/topic/child-health/immunization/
[2] Africa Diphtheria-Pertussis-Tetanus Vaccine Coverage Geospatial Estimates 2000-2016. (2019). Institute for Health Metrics and Evaluation (IHME). Retrieved from https://ghdx.healthdata.org/record/ihme-data/africa-diphtheria-pertussis-tetanus-vaccine-coverage-geospatial-estimates-2000-2016
[3] Edson Utazi, C., Thorley, J., Alegana, V. A., Ferrari, M. J., Takahashi, S., Metcalf, C. J., … Tatem, A. J. (2020, February 23). Mapping vaccination coverage to explore the effects of delivery mechanisms and inform vaccination strategies. Retrieved from https://www.ncbi.nlm.nih.gov/pmc/articles/PMC6456602/
[4] Pezzulo, C., Bird, T., Utazi, E. C., Sorichetta, A., Tatem, A. J., Yourkavitch, J., & Burgert-Brucker, C. R. (2016, August). Geospatial Modeling of Child Mortality across 27 Countries in Sub-Saharan Africa. Retrieved from https://www.dhsprogram.com/pubs/pdf/SAR13/SAR13.pdf
[5] Poy, A., Van den Ent, M. M. V. X., Sosler, S., Hinman , A. R., Brown, S., Sodha , S., … Mihigo, R. (n.d.). Monitoring Results in Routine Immunization: Development of Routine Immunization Dashboard in Selected African Countries in the Context of the Polio Eradication Endgame Strategic Plan . Retrieved February 23, 2020, from https://academic.oup.com/jid/article/216/suppl_1/S226/3935057
[6] Peck, M., Gacic-Dobo, M., Diallo, M. S., Nedelec, Y., Sodha, S. S., & Wallace, A. S. (2019, October 24). Global Routine Vaccination Coverage, 2018. Retrieved from https://www.cdc.gov/mmwr/volumes/68/wr/mm6842a1.htm
[7] Panciera, R., & Muñiz, M. (2018, October). Guidance on the Use of Geospatial Data and Technologies in Immunization Programs. Retrieved from https://www.unicef.org/media/58181/file
[8] Vaccine Information Statement. (2020, April 1). Retrieved from https://www.cdc.gov/vaccines/hcp/vis/vis-statements/dtap.html
[9] Schlesinger, J. (2013, January 1). Agriculture along the urban-rural continuum : a GIS-based analysis of spatio-temporal dynamics in two medium-sized African cities. Retrieved from https://www.researchgate.net/publication/283648245_Agriculture_along_the_urban-rural_continuum_a_GIS-based_analysis_of_spatio-temporal_dynamics_in_two_medium-sized_African_cities
[10] Sub-Saharan Africa . (2019). Retrieved from https://data.worldbank.org/region/sub-saharan-africa